Takeen Shamloo
Home
About
Blog
Categories
All
(4)
My Blogs
EDS 240: Homework #4
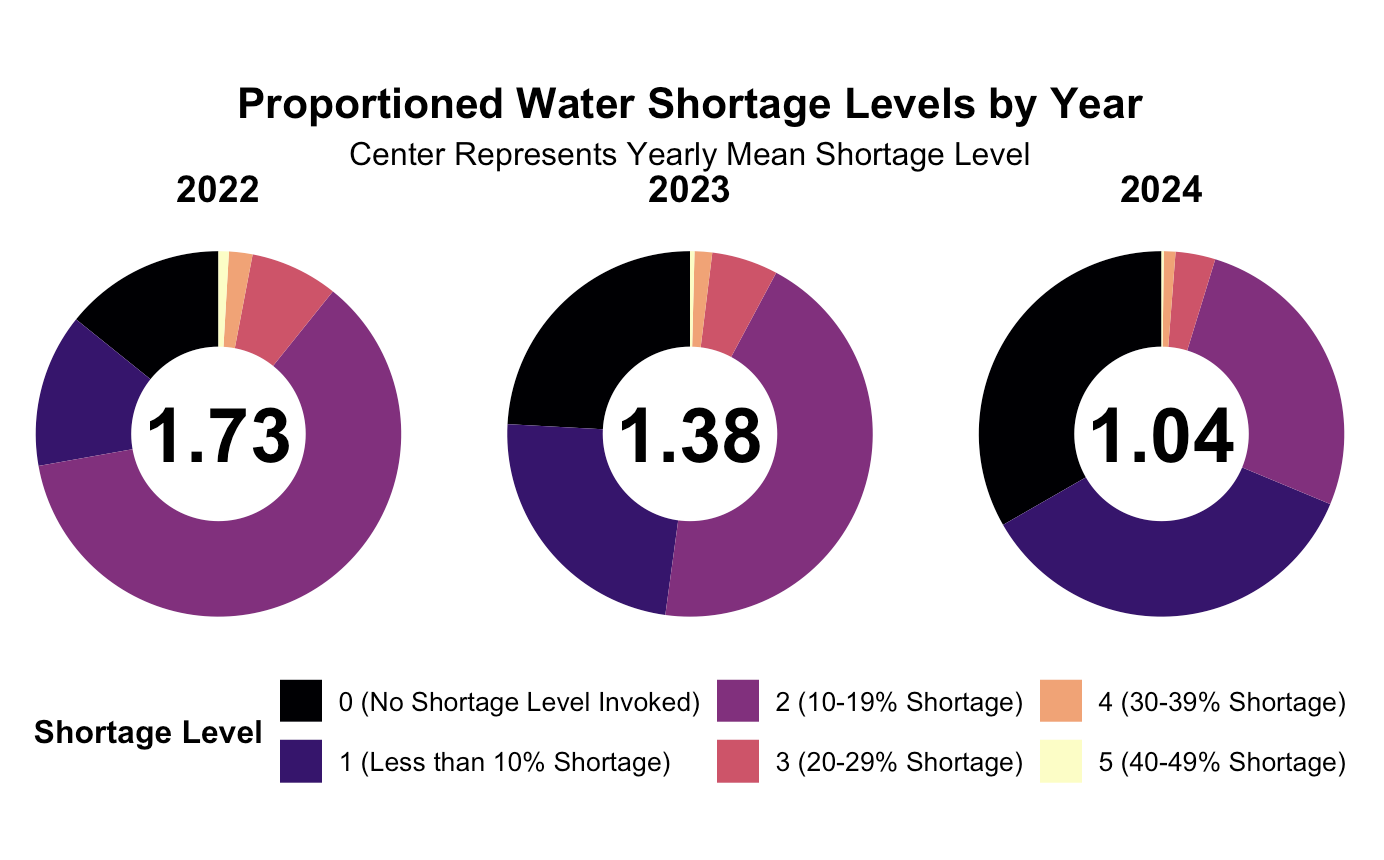
California is no stranger to dry weather and strict water regulations. Yet despite these restrictive measures, getting a clear picture of whats happening often means sifting…
Takeen Shamloo
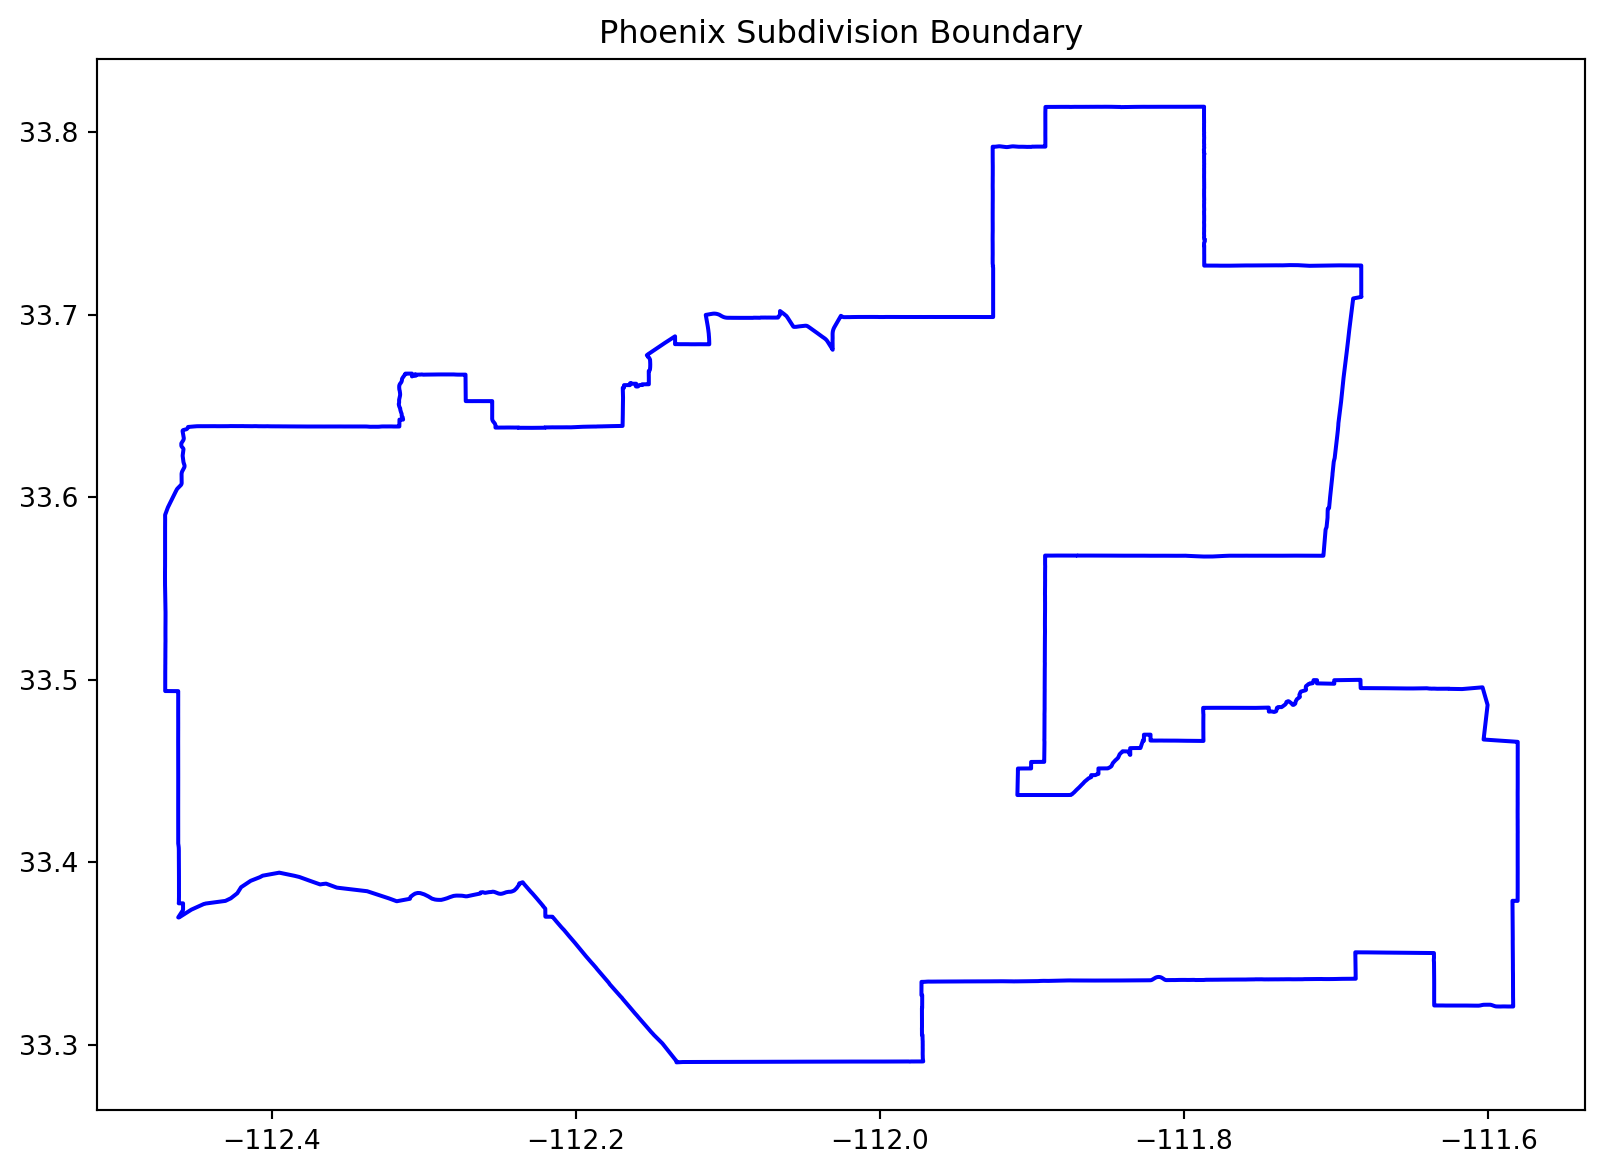
Biodiversity Intactness Analysis for Phoenix Subdivision
View full repo: GitHub Link
Visualizing and Understanding the Thomas Fire
By: Takeen Shamloo
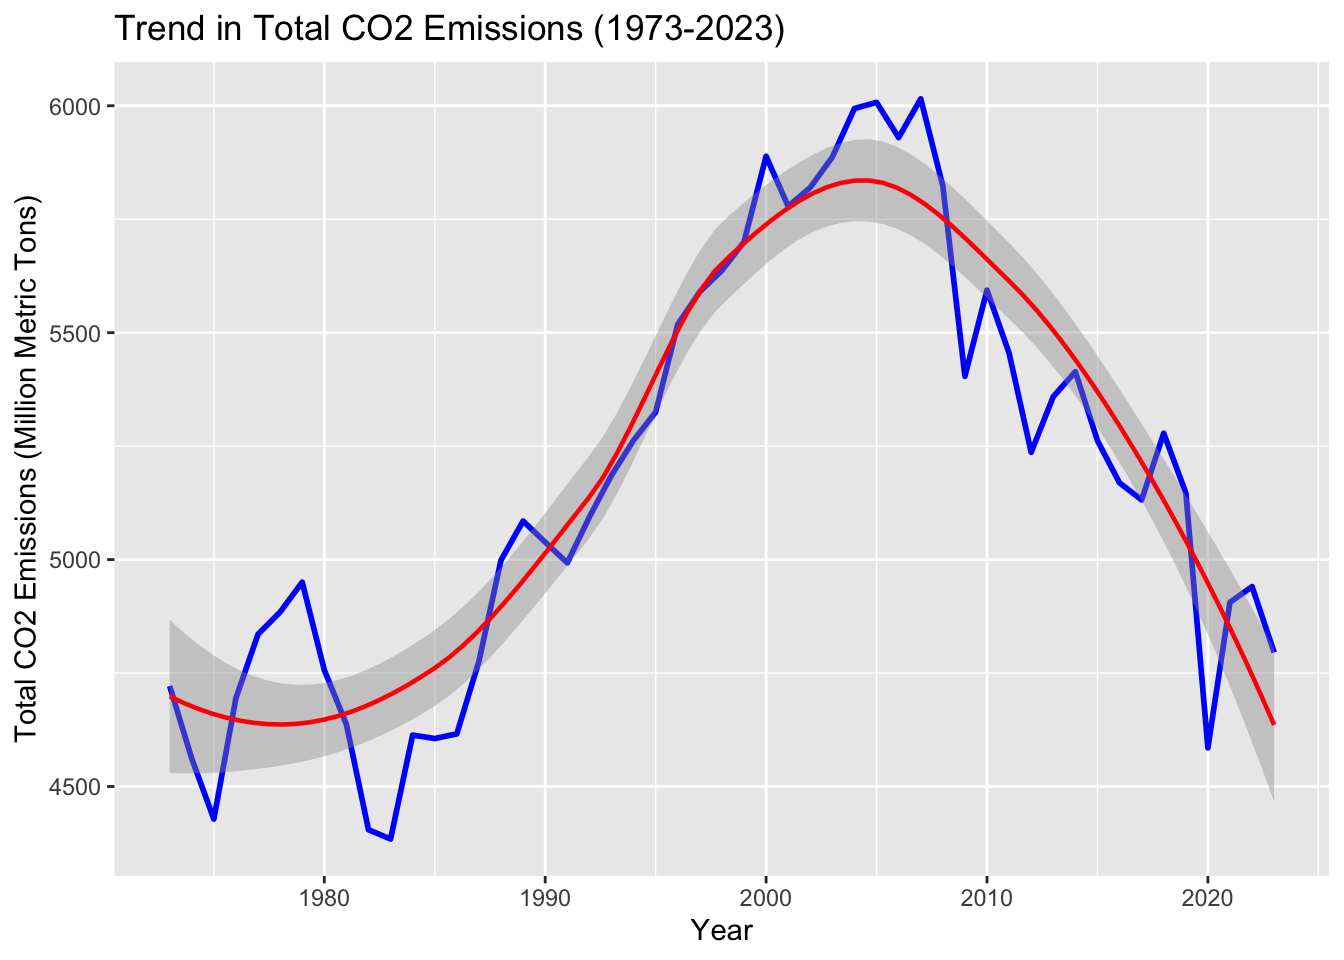
Greenhouse Gas Emissions Analysis
Introduction:
Takeen Shamloo
Dec 12, 2024
No matching items